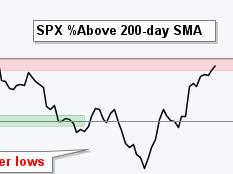
The stock market can be a tricky business. It’s no surprise that the highs and lows can be difficult for investors to understand and predict. However, sophisticated investors know that monitoring long-term breadth indicators can help them make more informed decisions.
Long-term breadth indicators are charts that measure the number of stocks advancing versus the number of issues declining in the stock market. The chart is composed of several time frames, which show the movement of these issues over an extended period of time – usually several years or more.
These charts, which measure the relative health of the market, have recently hit what is being called a “moment of truth”. At the moment, many of the charts are showing record-long internals that are bearish for both the short-term and long-term outlook.
To get a better understanding of what this means, it’s important to look at what long-term breadth indicators actually measure. Generally, they provide indications of whether investor sentiment is positive or negative, and if the market may be headed lower over a long period of time.
In addition, the charts are helpful in determining the health of a sector. They can also be used as a gauge of the overall sentiment of the market. The long-term breadth indicators are used by many investors to help determine when it might be safe to buy and sell or when to hold off.
These long-term breadth indicators are just one tool investors use to measure the health of the stock market. However, at the moment they are providing an extreme bearish view of the market for both the short-term and long-term outlooks. This could potentially be a sign of an impending market downturn and cause investors to take caution.
Overall, it’s important to keep an eye on long-term breadth indicators to make sure you have a full understanding of the health of the market. While no one knows for sure how the market will move, these indicators can provide valuable insights that could help investors make better decisions when navigating the market.
The Long-term: Expectation vs. Reality – Breadth Indicators at a Crossroads
previous post
